Featured Items

Recent Items

Links
Video

It’s one of the great philosophical debates of all time. Given enough computing horsepower, would we know the difference between the real world and a simulated one? With the cost of bandwidth, computing, and storage dropping precipitously, it’s harder and harder to tell the real from the simulated.

Check out the Lagoa Multiphysics plugin for Softimage. It’s pretty impressive. Tools like this do for interactive visualization what still-image tools like Photofuse do for traditional photographs.

You might argue that to really trick us into believing the world around us was a simulation, each particle the software represented could only consume one particle of computing infrastructure. But isn’t that what the universe looks like? And did I just blow your mind?

Links
Video

Apps without Programming

The new App Inventor takes Google’s “do what you like with your gadgets” approach one step further, by enabling anyone – even those who have never programmed before – to create their own apps with drag and drop ease.

App Inventor is a simple user interface for creating applications for the Android mobile platform, working in a similar way to Visual Basic – you drag buttons onto your screen and attach actions to them.

It’s interesting because in an age where there is fierce debate over whether you have the right to reprogram your device and customize it for your own use (consider Apple’s iOS vs Google’s Android), this presents a third option – by equipping ordinary people to develop exactly the functionality they need, without having to go outside the bounds of a controlled environment. Might we see Apple offer something similar for iPhones soon?

It’s also interesting to consider that if MySpace, Facebook and blogs took the idea of people creating websites and web content into the mainstream, what could happen if the capability to create software became equally mainstream? It would be sure to spark a total revolution in the way we think about computers…

Read more at CNET.

Links

Visualizing big data

Making sense of the huge reams of data around us isn’t easy. Sometimes it takes new visualizations and dimensions, like the ones in this photo set on Flickr, prepared as part of Wired UK‘s latest issue. The image at right shows how we can track human mobility from cellphone data.

As we drink from the firehose, we’ll get informational obesity — there’s a reason they call it a feed. New interfaces — from the immersive to the augmented — will be key to coping with it. This set has some tantalizing suggestions of what that might look like.

Links

A new survey shows that teens in the Ontario average seven hours a day of “screen time”.

The study grouped together time spent watching TV and Internet use as “sedentary behaviour” and suggests a link to a decline in physical and mental health among the students.

What’s interesting here is the implicit suggestion that a person’s entire use of a computer could be considered as a bad thing. Grouping all computer time together with watching TV as “screen time” is, I think, somewhat irresponsible and fails to recognize the diverse roles computers play in our lives.

It’s true that computers can be used for consuming content (YouTube videos or internet TV channels for example) as well as for solitary activities like playing games. These things should perhaps be moderated as you might TV use.

But computers can be used for so many other things now – researching homework assignments, communicating with friends, collaborating with other students, planning trips or shopping. So to group all these activities together as if they are all self-indulgent activities that could be completely avoided is unrealistic at best.

The reality is that computers are now so integrated into our daily lives, and even more so with the younger generation, that to consider taking “screens” out of the equation wholly is simply not possible.

A more interesting piece of research would separate solitary entertainment activities from productive or communication activities, and also look at the differences between students doing such activities offline or online.

It’s also worth considering what the researchers might have found if they’d looked at adults. Most of the office-bound population has seven hours of sedentary time a day – it’s called doing their work at their desk! In this context, the researchers findings are nothing special.

Read more of the study at CBC News.

In other news, researchers find that people use computers a lot…

Links
Video

AR meets 3D modeling

Techi has a piece on Leonar3Do, a new take on 3D modeling. It looks as far from traditional modeling tools as they were from pen and paper.

Years ago, I played around with 3D modeling (and narrowly avoided a career at Matrox and Softimage in the process.) Building models was tedious: manipulating 3D space with two-dimensional tools like a mouse and a screen is tough. Software relies on all sorts of controllers, UI conceits, and tricks: rotating the onscreen image; holding down shift to move along the third dimension, and so on.

Google acquired Sketchup to help crowdsource 3D content for Google Earth largely because it was comparatively easy to use. But so far, we can’t work with 3D content in three dimensions.

That’s about to change: using modeling tools and AR visualization, designers can actually manipulate in three dimensions. Which will go a long way to making 3D models mainstream, unlocking all kinds of use cases.

Who knows, maybe soon, we’ll have opt-in vandalism, where taggers add 3D objects to the real world for those who want to see them.

Links
Video

I’ve been spending a lot of time on interfaces and visualization lately, as part of a new conference that melds Big Data, Ubiquitous Computing, and New Interfaces. Along the way, I was struck by these two extremes of visualization.

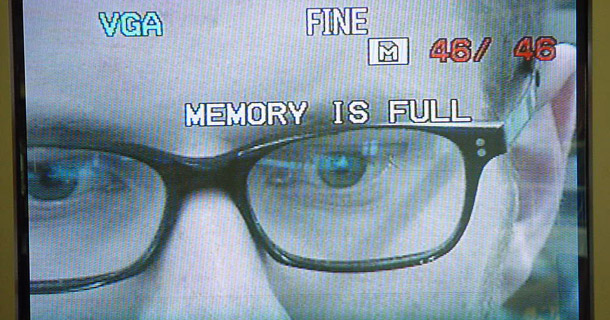
At one extreme, there’s the Canadian filmmaker who’s implanted a camera in his eye socket. It’s a great example of embedded, ubiquitous data collection — something we’ll likely all take for granted very soon. This is visualization in the truest sense.

At the other end of the spectrum is the Allosphere, an immersive, three-storey-tall sphere used for visualizing and interacting with data.

These two spheres are very different. One collects a single person’s perspective; the other reveals huge amounts of data. One shows things at an intimate, human scale; the other zooms out to galazies or in to neurons.

Links

The well known sci-fi movie trilogy Back to the Future got a lot of attention online yesterday when it was “revealed” that July 5th, 2010 was the date in the future that Marty and the Doc travel to at the start of the second movie. The only problem is, as the more astute fans will know, that this date never actually featured in the movies. The date in question is actually in 2015.

The mistake originated from Total Film magazine in the UK, and when they discovered their mistake, they jokingly “went back in time to fix it” (a.k.a. photoshopping a screen capture from the movie). Unfortunately, this image then spread around the Internet as “proof” that July 5th 2010 was really in the movie. Soon the Future day meme was trending on Twitter and receiving tens of thousands of searches on Google. There’s even a new variant of the image with July 6th as the date… and the meme continues.

This incident highlights both the speed at which information spreads online, and also how readily people will accept anything they read online, without taking the time to dig deeper or verify facts – something that will become more and more commonplace as we become more saturated with information from so many sources.

Read the full story at Total Film.

Links

Finland becomes the first country in the world to make Internet access a legal right for its citizens, at a minimum speed of 1Mbps, when a new law comes into force today.

This means that ISPs cannot refuse to connect someone, no matter how costly or remote. It’s a technical and financial challenge for ISPs, but great for helping the world move towards an open, connected future and avoiding a divided society with “haves and have nots”.

Meanwhile, the UK is moving in the opposite direction, with the recently passed Digital Economy Act threatening to disconnect users who are accused of copyright infringement. A new government initiative called Your Freedom invites the public to reclaim lost freedoms by voting for laws to repeal. Perhaps we will see a course-correction soon.

Read more here and here.

Posts

Is Zynga’s break with Facebook a sign that software developers, feeling trapped by the platforms on which they grew, want to down the garden wall?

The biggest app maker on Facebook may want to break up with the social network site. Flash and Apple have divorced, citing irreconcilable differences. We’re moving past the days of net neutrality, into those of app neutrality. Are the garden walls of social networks and mobile devices ready to crumble, just as rigidly controlled online services gave way to the Web fifteen years ago?

Read more »

Powered by WordPress, based on Mina theme.